Projects — Prints 2.6
We’ll group the projects together today.
Family pedigrees
An old-yet-new chart type: family pedigrees.
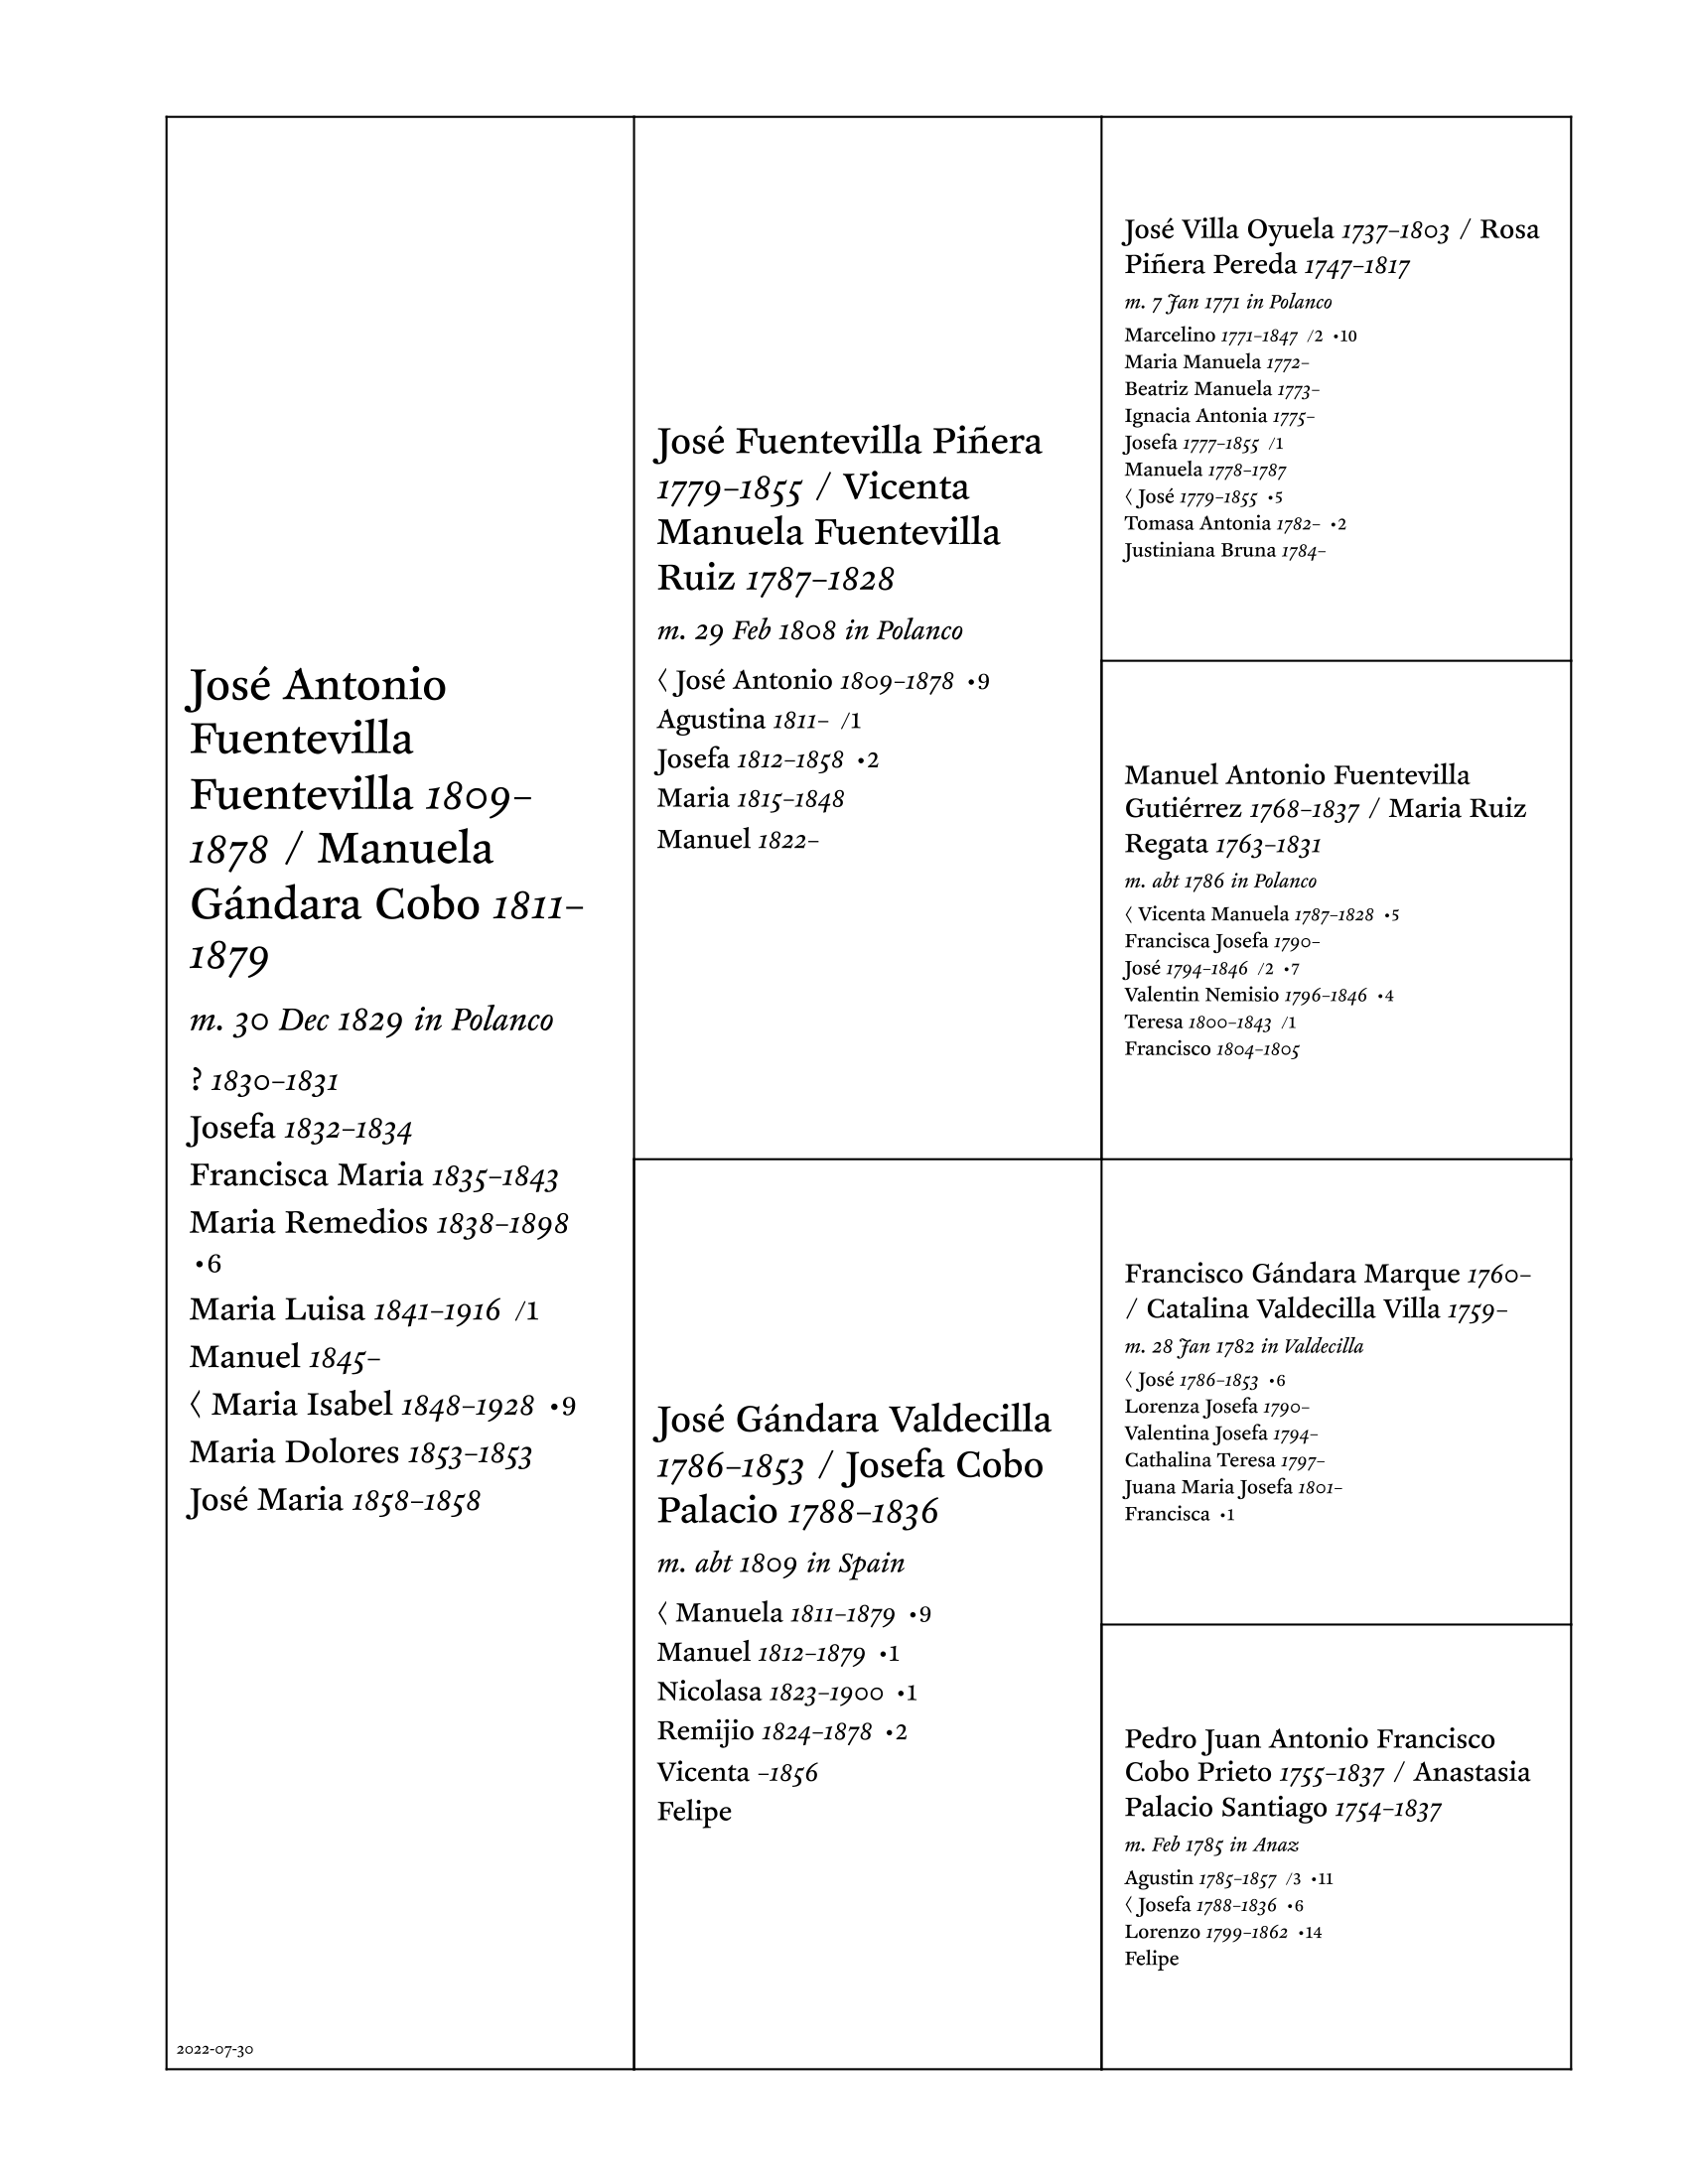
As you can see, it’s a little different from the initial design. This modern incarnation admittedly isn’t as pretty in some ways, but it’s a heck of a lot easier to lay out programmatically.
New things: It shows which child the line comes through, I added the lifespan right after each parent’s name, and I added indicators for the children showing how many kids they had (the dot) and how many marriages (the slash, though if they were married only once and had children, I left the marriage indicator off).
It also supports four generations, admittedly with less space and smaller type:
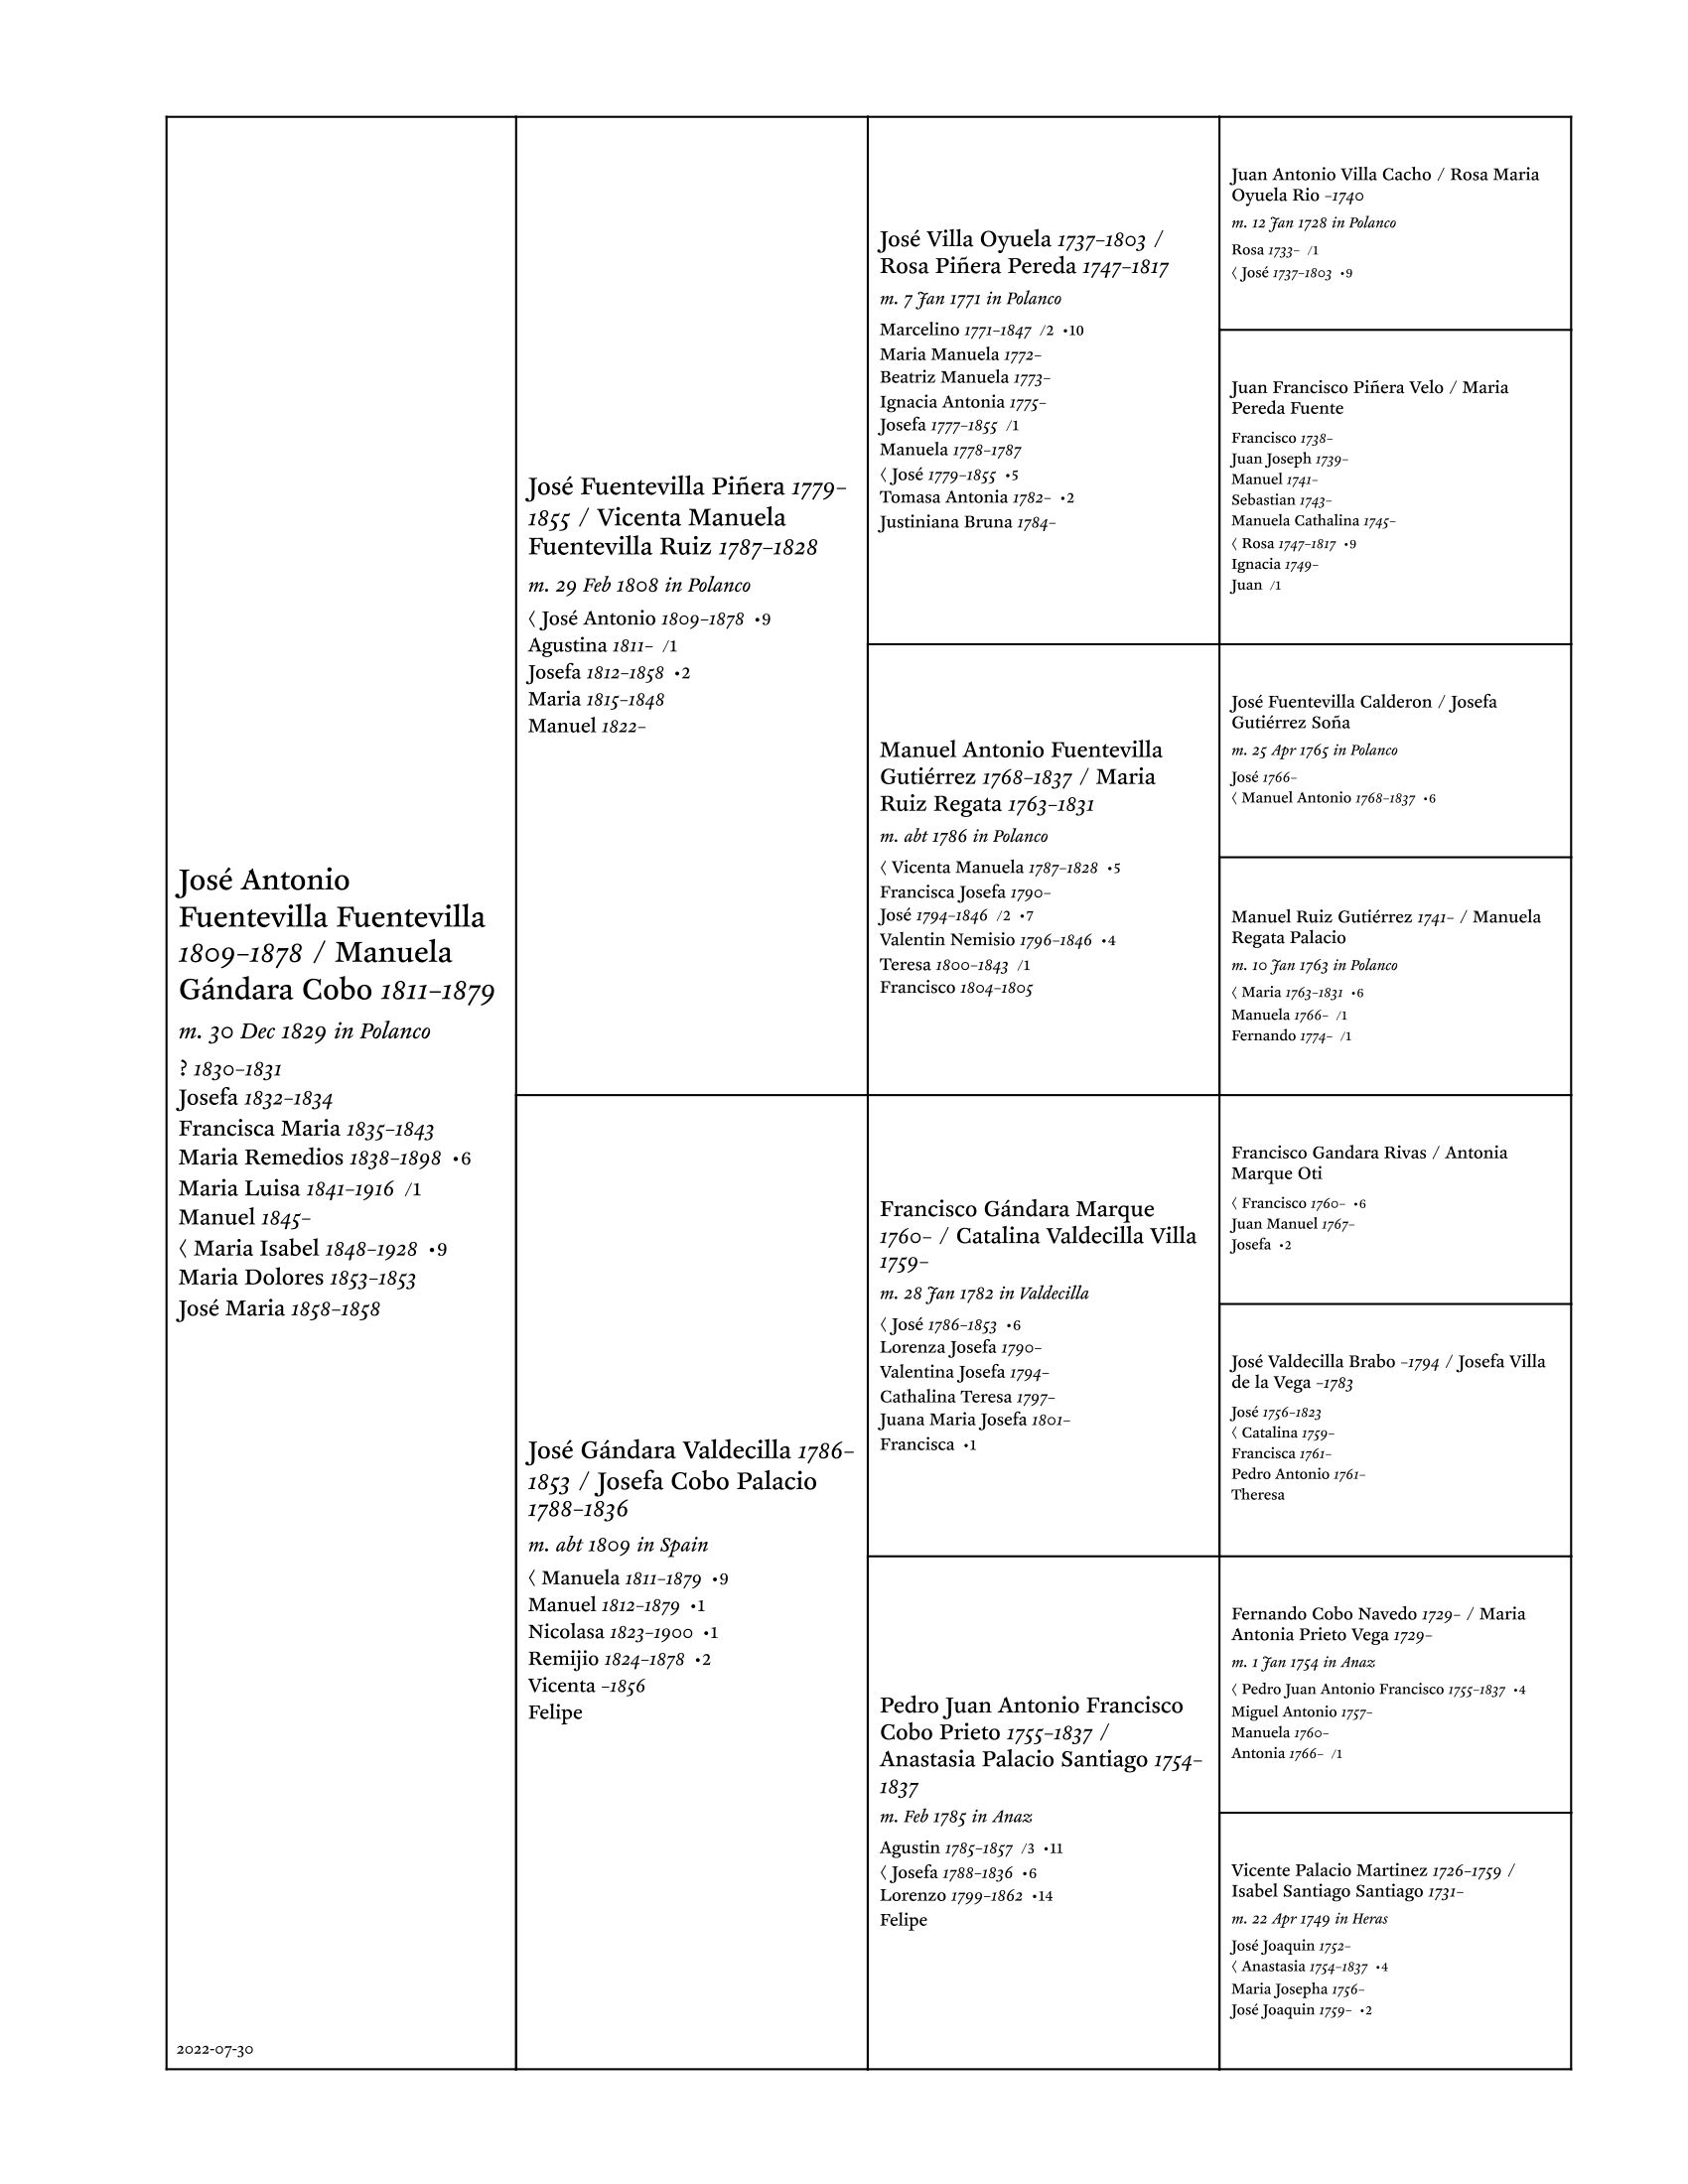
I tried it without the table borders, by the way. While it was more readable than I expected, it felt a little too loose and unmoored.
The input uses ArchieML and currently looks like this:
[families]

family: 1.1
marriage: 30 Dec 1829 in Polanco
father: José Antonio Fuentevilla Fuentevilla // 1809-1878
mother: Manuela Gándara Cobo // 1811-1879
[.children]
  name: ? // 1830-1831

  name: Josefa // 1832-1834

  name: Francisca Maria // 1835-1843

  name: Maria Remedios // 1838-1898
  children: 6

  name: Maria Luisa // 1841-1916
  marriages: 1

  name: Manuel // 1845-

  name: < Maria Isabel // 1848-1928
  children: 9

  name: Maria Dolores // 1853-1853

  name: José Maria // 1858-1858
[]

# --------------------------------------

family: 2.1
marriage: 29 Feb 1808 in Polanco
father: José Fuentevilla Piñera // 1779-1855
mother: Vicenta Manuela Fuentevilla Ruiz // 1787-1828
[.children]
  name: < José Antonio // 1809-1878
  children: 9

  ...etc.
[]

...etc.
Right now the family numbering is table-based (column, row), but eventually I think I probably want to make it hierarchical (somehow) so it’s easier to know which cell to put things in.
Timeline charts
Another new chart of sorts: timelines. I’ve been sorting through my Cuban lines and realized I needed some way to map out everybody so I could see the bigger picture.
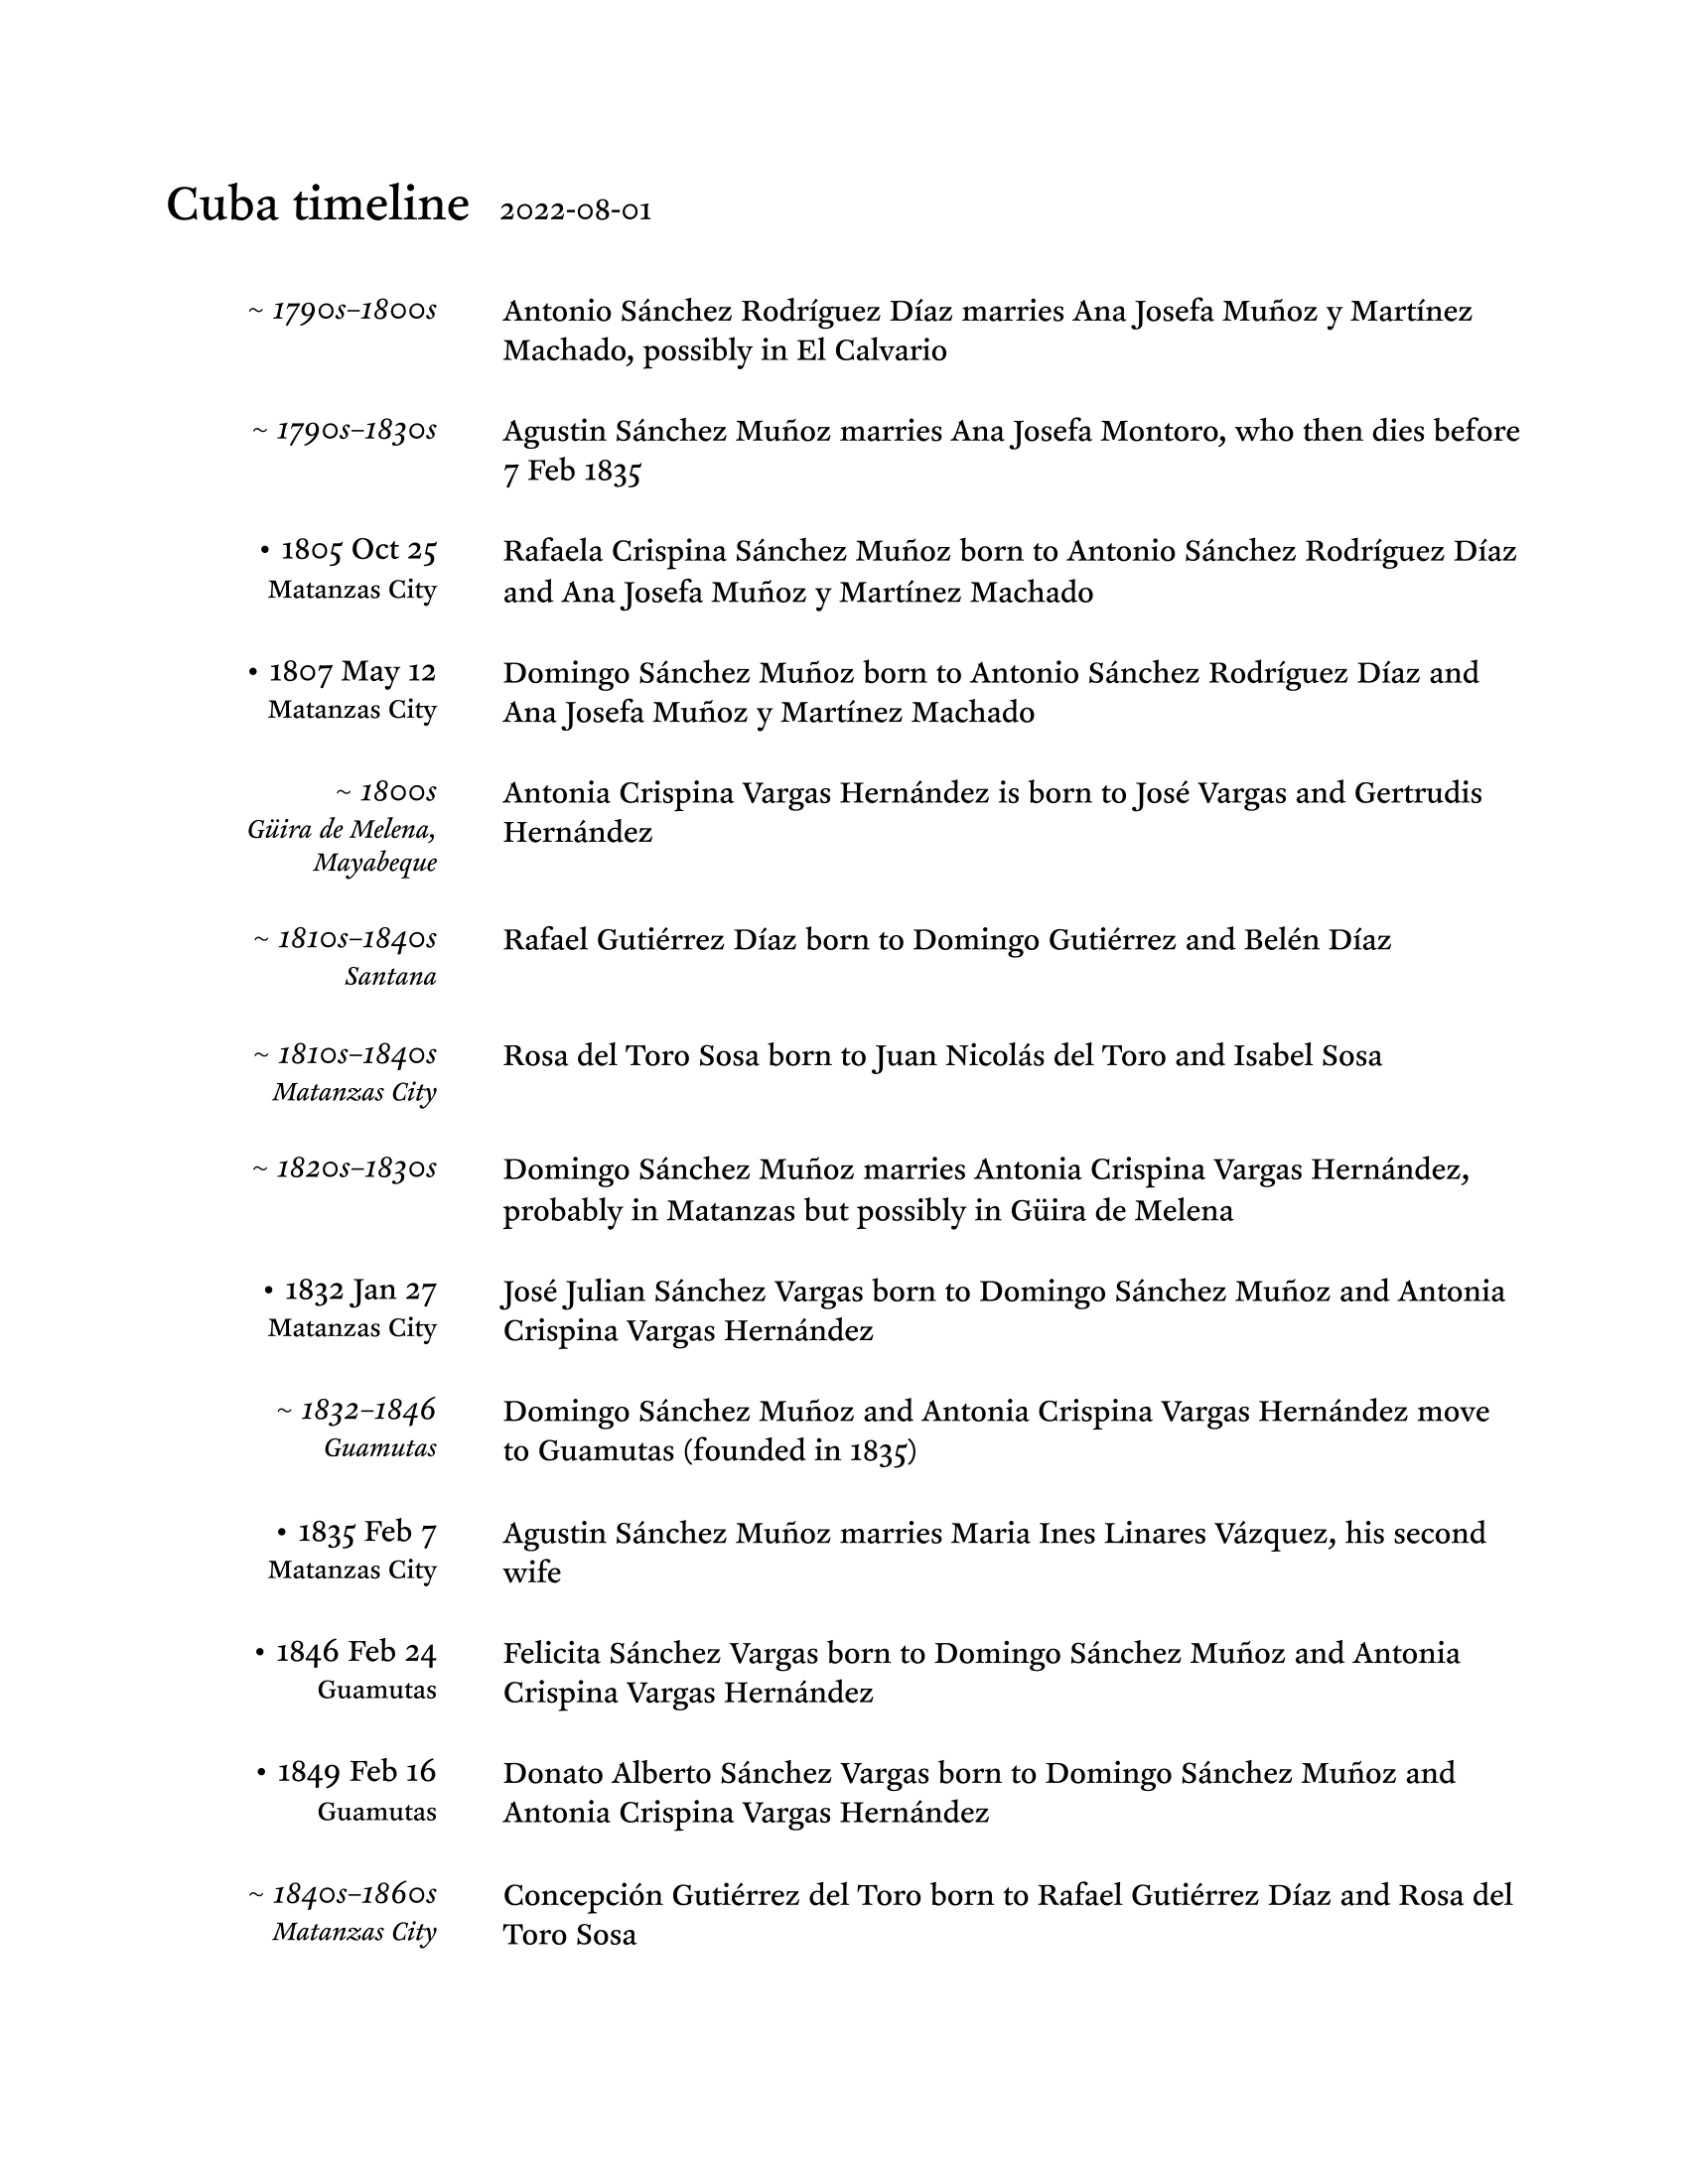
The input is an ArchieML file that just lists events with dates and optional places:
title: Cuba timeline

[timeline]

event: Antonio Sánchez Rodríguez Díaz marries Ana Josefa Muñoz y Martínez Machado, possibly in El Calvario
daterange: 1790s-1800s

event: Agustin Sánchez Muñoz marries Ana Josefa Montoro, who then dies before 7 Feb 1835
daterange: 1790s-1830s

event: Rafaela Crispina Sánchez Muñoz born to Antonio Sánchez Rodríguez Díaz and Ana Josefa Muñoz y Martínez Machado
date: 1805 Oct 25
place: Matanzas City

event: Domingo Sánchez Muñoz born to Antonio Sánchez Rodríguez Díaz and Ana Josefa Muñoz y Martínez Machado
date: 1807 May 12
place: Matanzas City

event: Antonia Crispina Vargas Hernández is born to José Vargas and Gertrudis Hernández
daterange: 1800s
place: Güira de Melena, Mayabeque

...etc.
If the date is a range, it’s italicized to show that it’s broader than a specific date.
(I originally was just going to use Google Docs for this, by the way, and made an initial prototype there. Having to do all the formatting manually got old, though, so I scripted it. Now I can just focus on the content.)
Family sheets update
I’ve got almost all the family sheet functionality ported to Node/JavaScript and cleaned up. (The sparklines code now uses tracks and markers in a way that is much more extensible and easier to work with.) In the process, I also revised the resolution (before, it just keyed off the year, but now it uses the month and day if present as well, so spacing is more accurate), added dotted-line support for date ranges (for birth and death), and added a marker for divorce (a skinny X):

Still have a number of bugs to fix, but it’s getting close.
Tabular pedigrees update
I ported the tabular pedigrees to Node/JavaScript and added support for seven-generation charts:
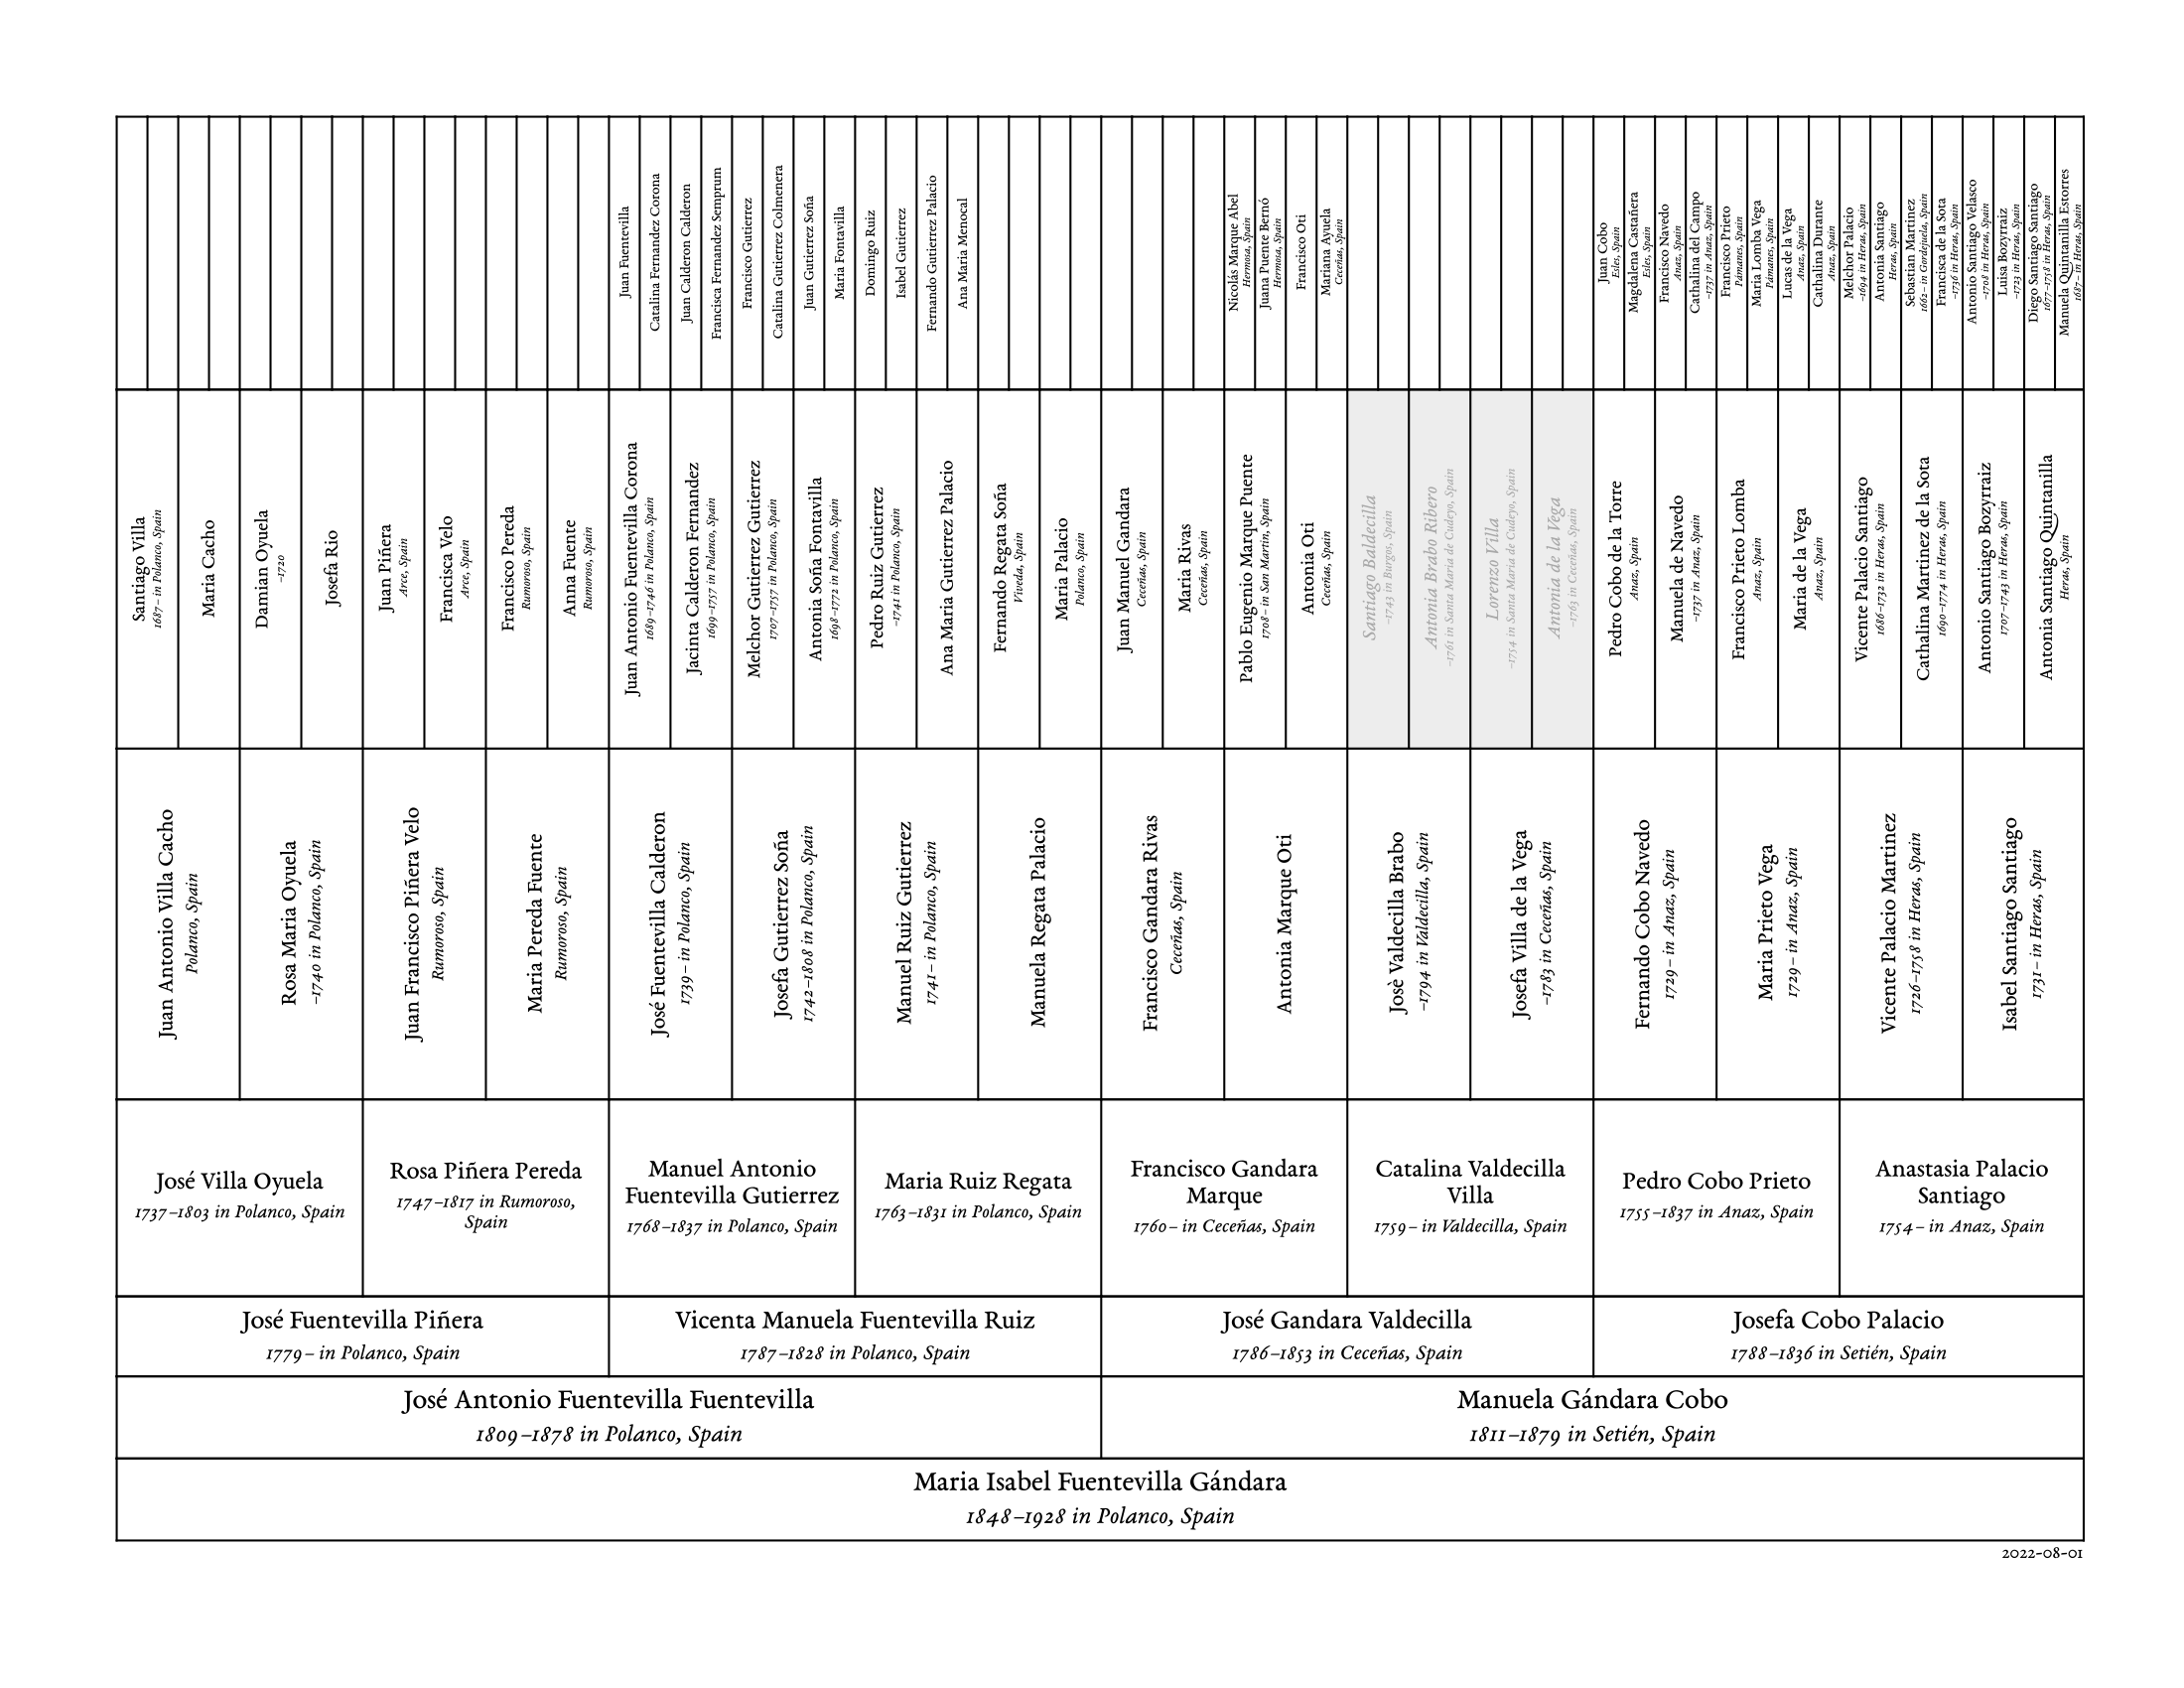
Comparison to the six-generation chart:
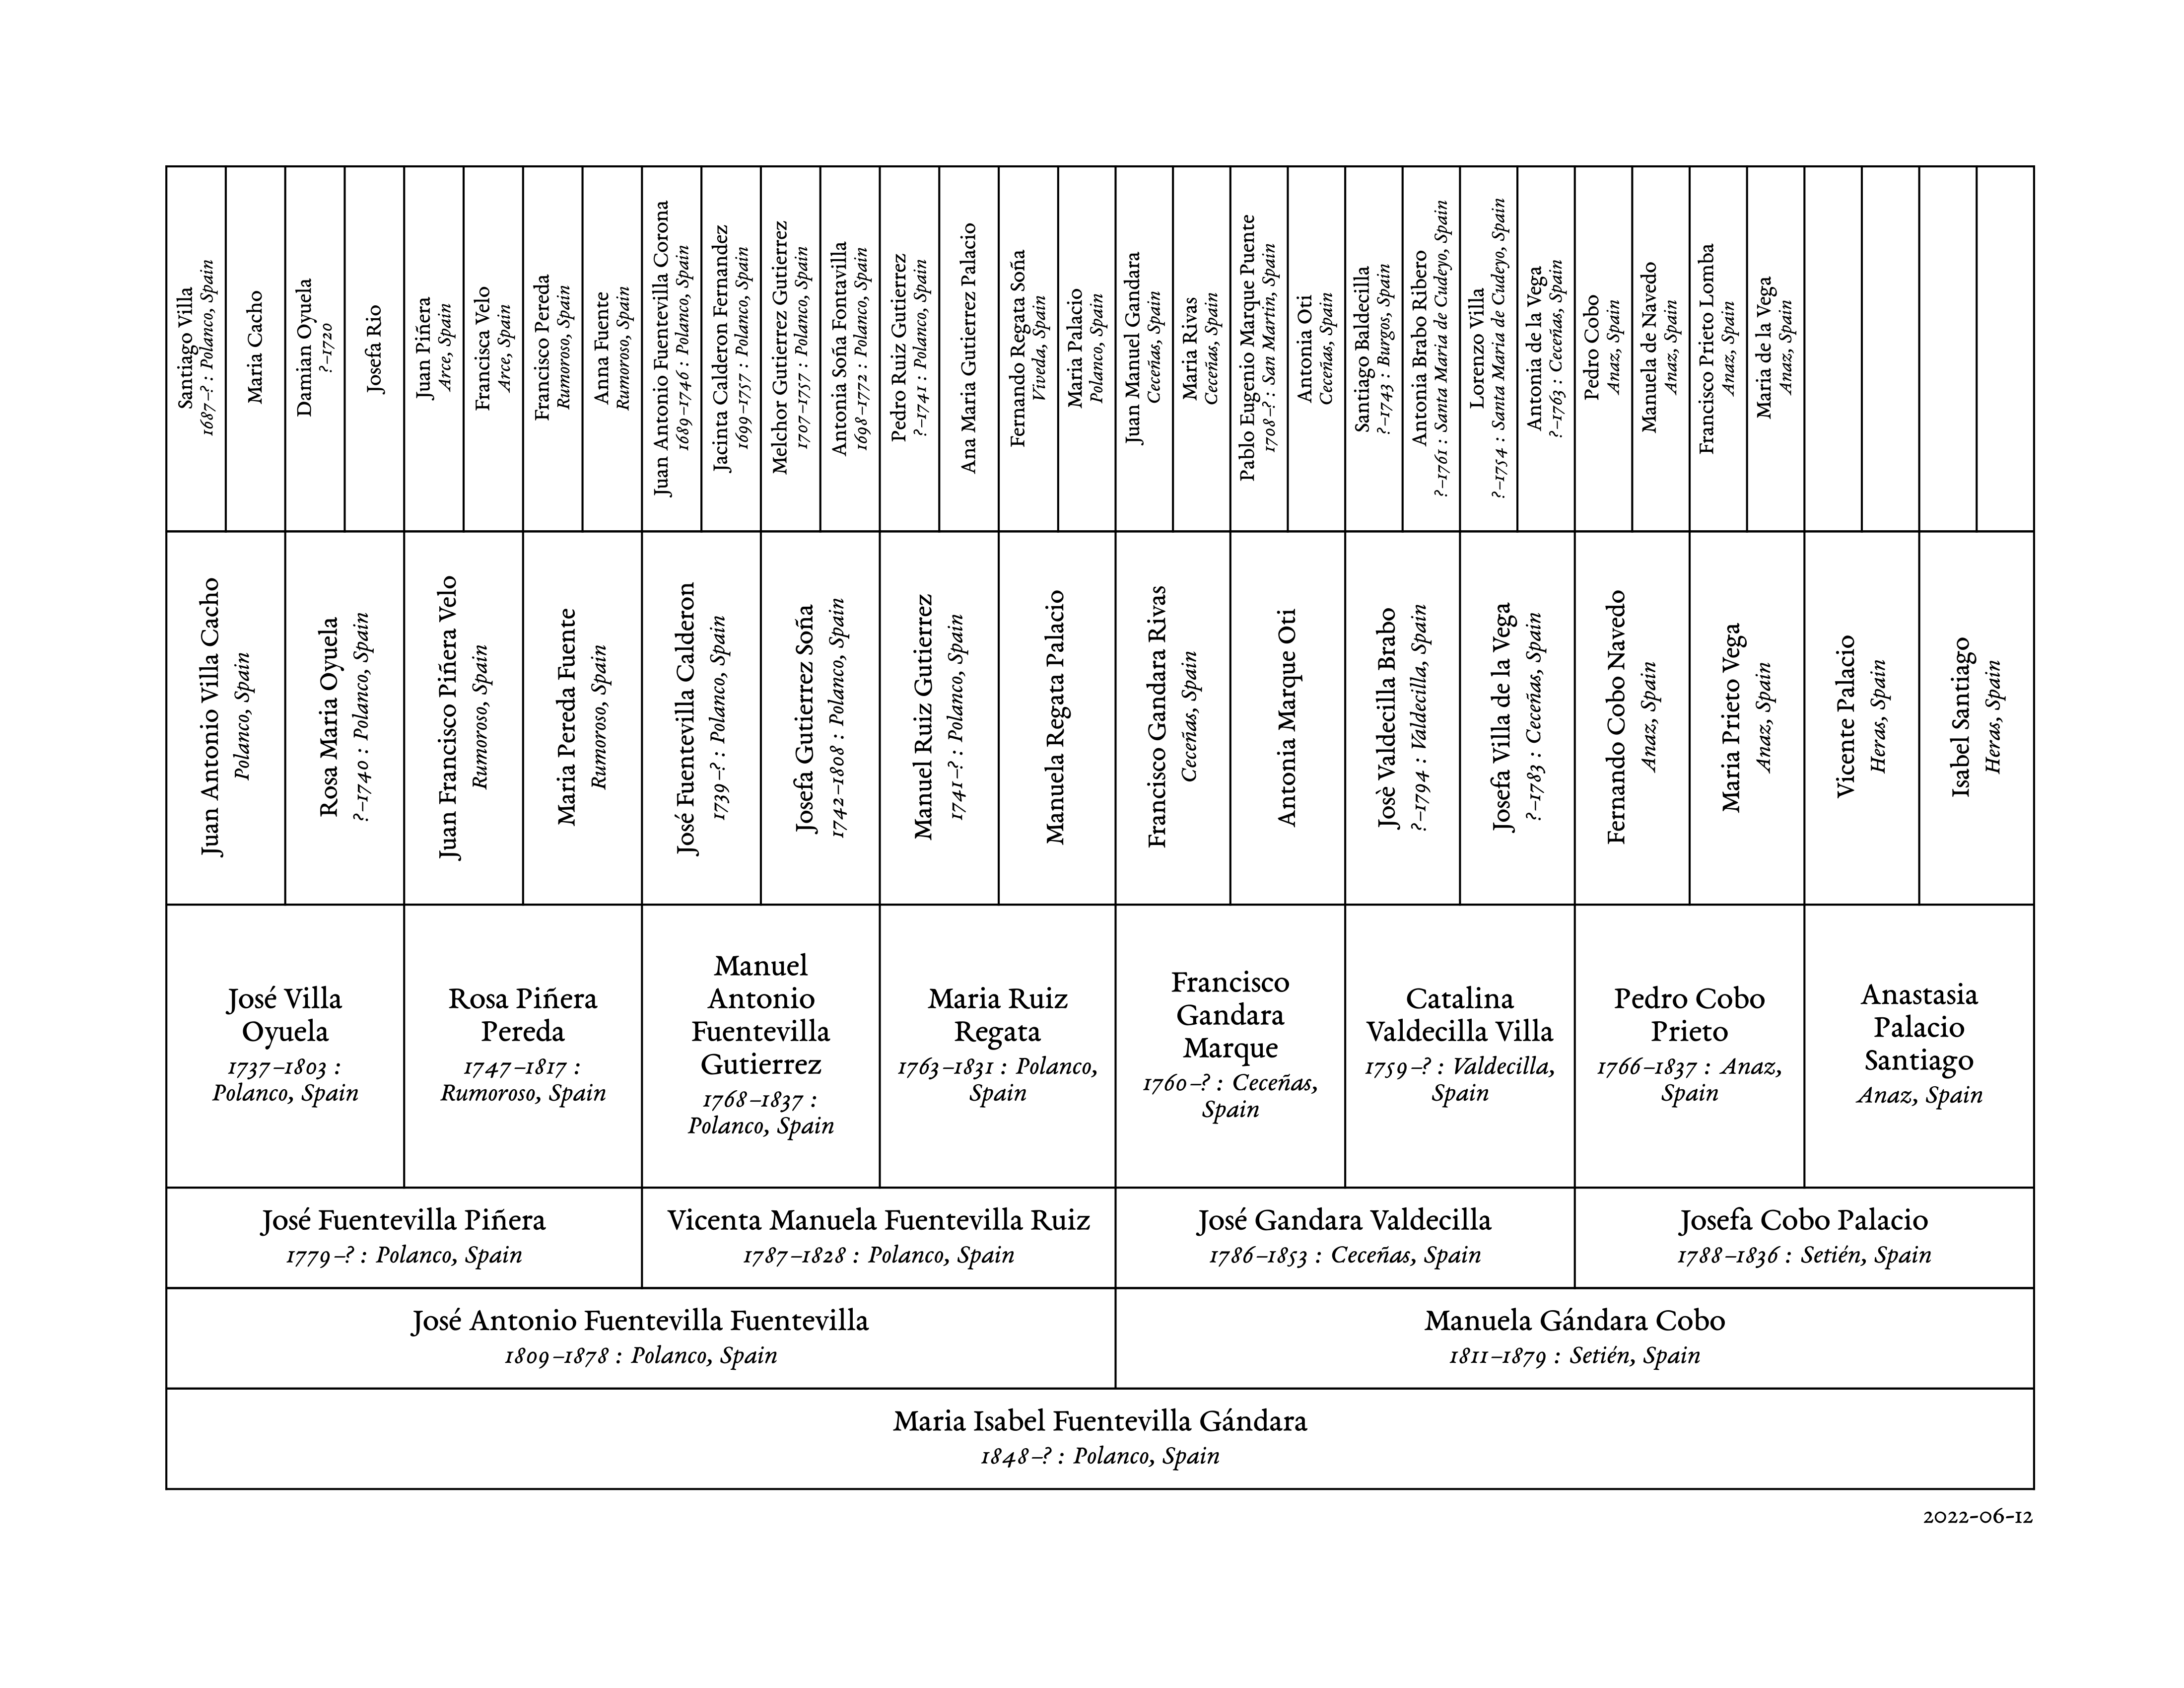
The shaded cells, by the way, indicate that I haven’t yet verified those people. Basically a TODO comment for myself.
Can’t wait till Chrome supports border stroke widths smaller than 1pt.
Quick links
Last and sort of least, I’m slowly putting together a page with quick links to the various Torre de’ Passeri civil registration scans on FamilySearch, to save myself some time. Planning to do this for the other localities I do research in as well.